Untitled 4
Workplace Wellness
Count Headaches
Count Forearm
Count Arm
Count Spine
Count Legs
Count Neuro-hands
Count Neuro-legs
Count Ergonomics
Count Stress
Number of employees suffering pain, where the pain is, how severe it is and possible causes.
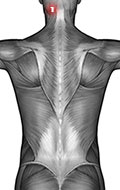
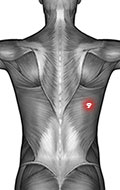
SPINE
How severe are your employees spinal symptoms?
Area Left 1
Count
Left 1: severe
4
Left 1: high
2
Left 1: medium
5
Left 1: low
2
Improving
1
Same
0
Worse
0
Area Left 2
Count
Left 2: severe
1
Left 2: high
7
Left 2: medium
1
Left 2: low
0
Improving
1
Same
0
Worse
0
Area Left 3
Count
Left 3: severe
4
Left 3: high
4
Left 3: medium
0
Left 3: low
0
Improving
1
Same
0
Worse
0
Area Left 4
Count
Left 4: severe
0
Left 4: high
0
Left 4: medium
3
Left 4: low
4
Improving
1
Same
0
Worse
0
Area Left 5
Count
Left 5: severe
2
Left 5: high
1
Left 5: medium
3
Left 5: low
1
Improving
1
Same
0
Worse
0
Area Left 6
Count
Left 6: severe
1
Left 6: high
2
Left 6: medium
2
Left 6: low
0
Improving
1
Same
0
Worse
0
Area Left 7
Count
Left 7: severe
0
Left 7: high
1
Left 7: medium
2
Left 7: low
0
Improving
1
Same
0
Worse
0
Area Left 8
Count
Left 8: severe
0
Left 8: high
0
Left 8: medium
1
Left 8: low
1
Improving
1
Same
0
Worse
0
Area Left 9
Count
Left 9: severe
0
Left 9: high
1
Left 9: medium
1
Left 9: low
0
Improving
1
Same
0
Worse
0
Area Left 10
Count
Left 10: severe
0
Left 10: high
0
Left 10: medium
2
Left 10: low
0
Improving
1
Same
0
Worse
0
Area Left 11
Count
Left 11: severe
0
Left 11: high
0
Left 11: medium
2
Left 11: low
0
Improving
1
Same
0
Worse
0
Area Left 12
Count
Left 12: severe
0
Left 12: high
0
Left 12: medium
1
Left 12: low
0
Improving
1
Same
0
Worse
0
Area Left 13
Count
Left 13: severe
0
Left 13: high
0
Left 13: medium
2
Central 13: low
0
Improving
1
Same
0
Worse
0
Area Left 14
Count
Left 14: severe
0
Left 14: high
1
Left 14: medium
1
Left 14: low
0
Improving
1
Same
0
Worse
0
Right side: What severity of spine physical symptoms are there?
Area Right 1
Count
Right 1: severe
2
Right 1: high
3
Right 1: medium
1
Right 1: low
0
Improving
1
Same
0
Worse
0
Area Right 2
Count
Right 2: severe
0
Right 2: high
2
Right 2: medium
1
Right 2: low
0
Improving
1
Same
0
Worse
0
Area Right 3
Count
Right 3: severe
1
Right 3: high
1
Right 3: medium
1
Right 3: low
0
Improving
1
Same
0
Worse
0
Area Right 4
Count
Right 4: severe
1
Right 4: high
1
Right 4: medium
1
Right 4: low
0
Improving
1
Same
0
Worse
0
Area Right 5
Count
Right 5: severe
0
Right 5: high
1
Right 5: medium
1
Right 5: low
0
Improving
1
Same
0
Worse
0
Area Right 6
Count
Right 6: severe
0
Right 6: high
2
Right 6: medium
1
Right 6: low
0
Improving
1
Same
0
Worse
0
Area Right 7
Count
Right 7: severe
0
Right 7: high
1
Right 7: medium
1
Right 7: low
0
Improving
1
Same
0
Worse
0
Area Right 8
Count
Right 8: severe
0
Right 8: high
0
Right 8: medium
2
Right 8: low
0
Improving
1
Same
0
Worse
0
Area Right 9
Count
Right 9: severe
0
Right 9: high
1
Right 9: medium
1
Right 9: low
0
Improving
1
Same
0
Worse
0
Area Right 10
Count
Right 10: severe
1
Right 10: high
0
Right 10: medium
1
Right 10: low
0
Improving
1
Same
0
Worse
0
Area Right 11
Count
Right 11: severe
0
Right 11: high
1
Right 11: medium
1
Right 11: low
0
Improving
1
Same
0
Worse
0
Area Right 12
Count
Right 12: severe
0
Right 12: high
1
Right 12: medium
1
Right 12: low
0
Improving
1
Same
0
Worse
0
Area Right 13
Count
Right 13: severe
0
Right 13: high
0
Right 13: medium
1
Central 13: low
1
Improving
1
Same
0
Worse
0
Area Right 14
Count
Right 14: severe
0
Right 14: high
1
Right 14: medium
1
Right 14: low
0
Improving
1
Same
0
Worse
0
 Area Left 1
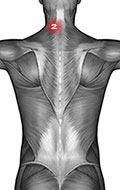 Area Left 2
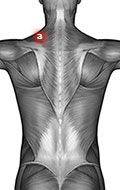 Area Left 3
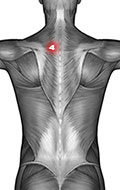 Area Left 4
 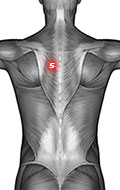 Area Left 5
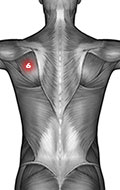 Area Left 6
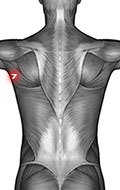 Area Left 7
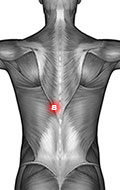 Area Left 8
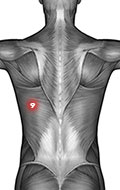 Area Left 9
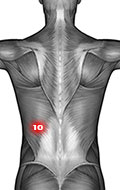 Area Left 10
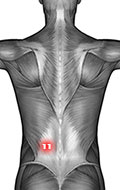 Area Left 11
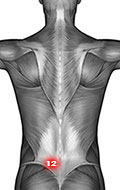 Area Left 12
 Area Left 13
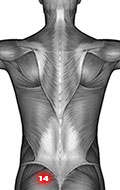 Area Left 14
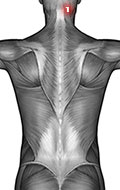 Area Right 1
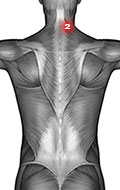 Area Right 2
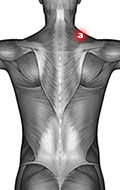 Area Right 3
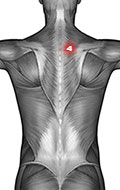 Area Right 4
 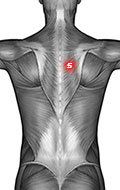 Area Right 5
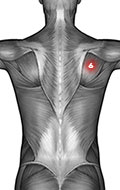 Area Right 6
 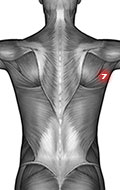 Area Right 7
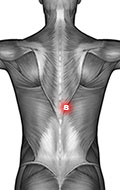 Area Right 8
 Area Right 9
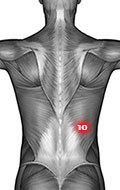 Area Right 10
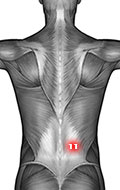 Area Right 11
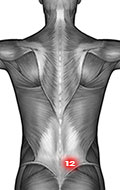 Area Right 12
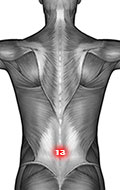 Area Right 13
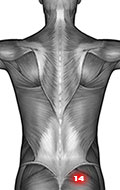 Area Right 14