Number of employees suffering pain, where the pain is, how severe it is and possible causes.
ARM
|
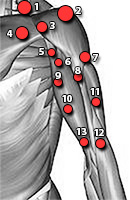 Area Left 1
|
|
|
|
|
|
|
|
|
|
|
|
|
How severe are your employees arm symptoms? |
|
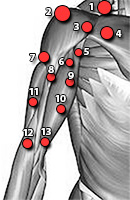 Area Right 1
|
|
|
|
|
|
|
|
|
|
|
|
|
|
|
|
|
|
|
|
|
|
|
|
|
|
How severe are your employees arm symptoms? |
|
|
|
|
|
|
|
|
|
|
|
|
|